Report formulas
Who can see reports
- Access View reports & export CSV (Reports group). By default: Supervisor and admin roles; the Owner always.
- Figures follow the same data limits as the inbox and tickets: conversations & tickets you are not allowed to see (other teams, numbers you have no access to) are not counted. Two people can see different figures for the same range.
Range & time zone
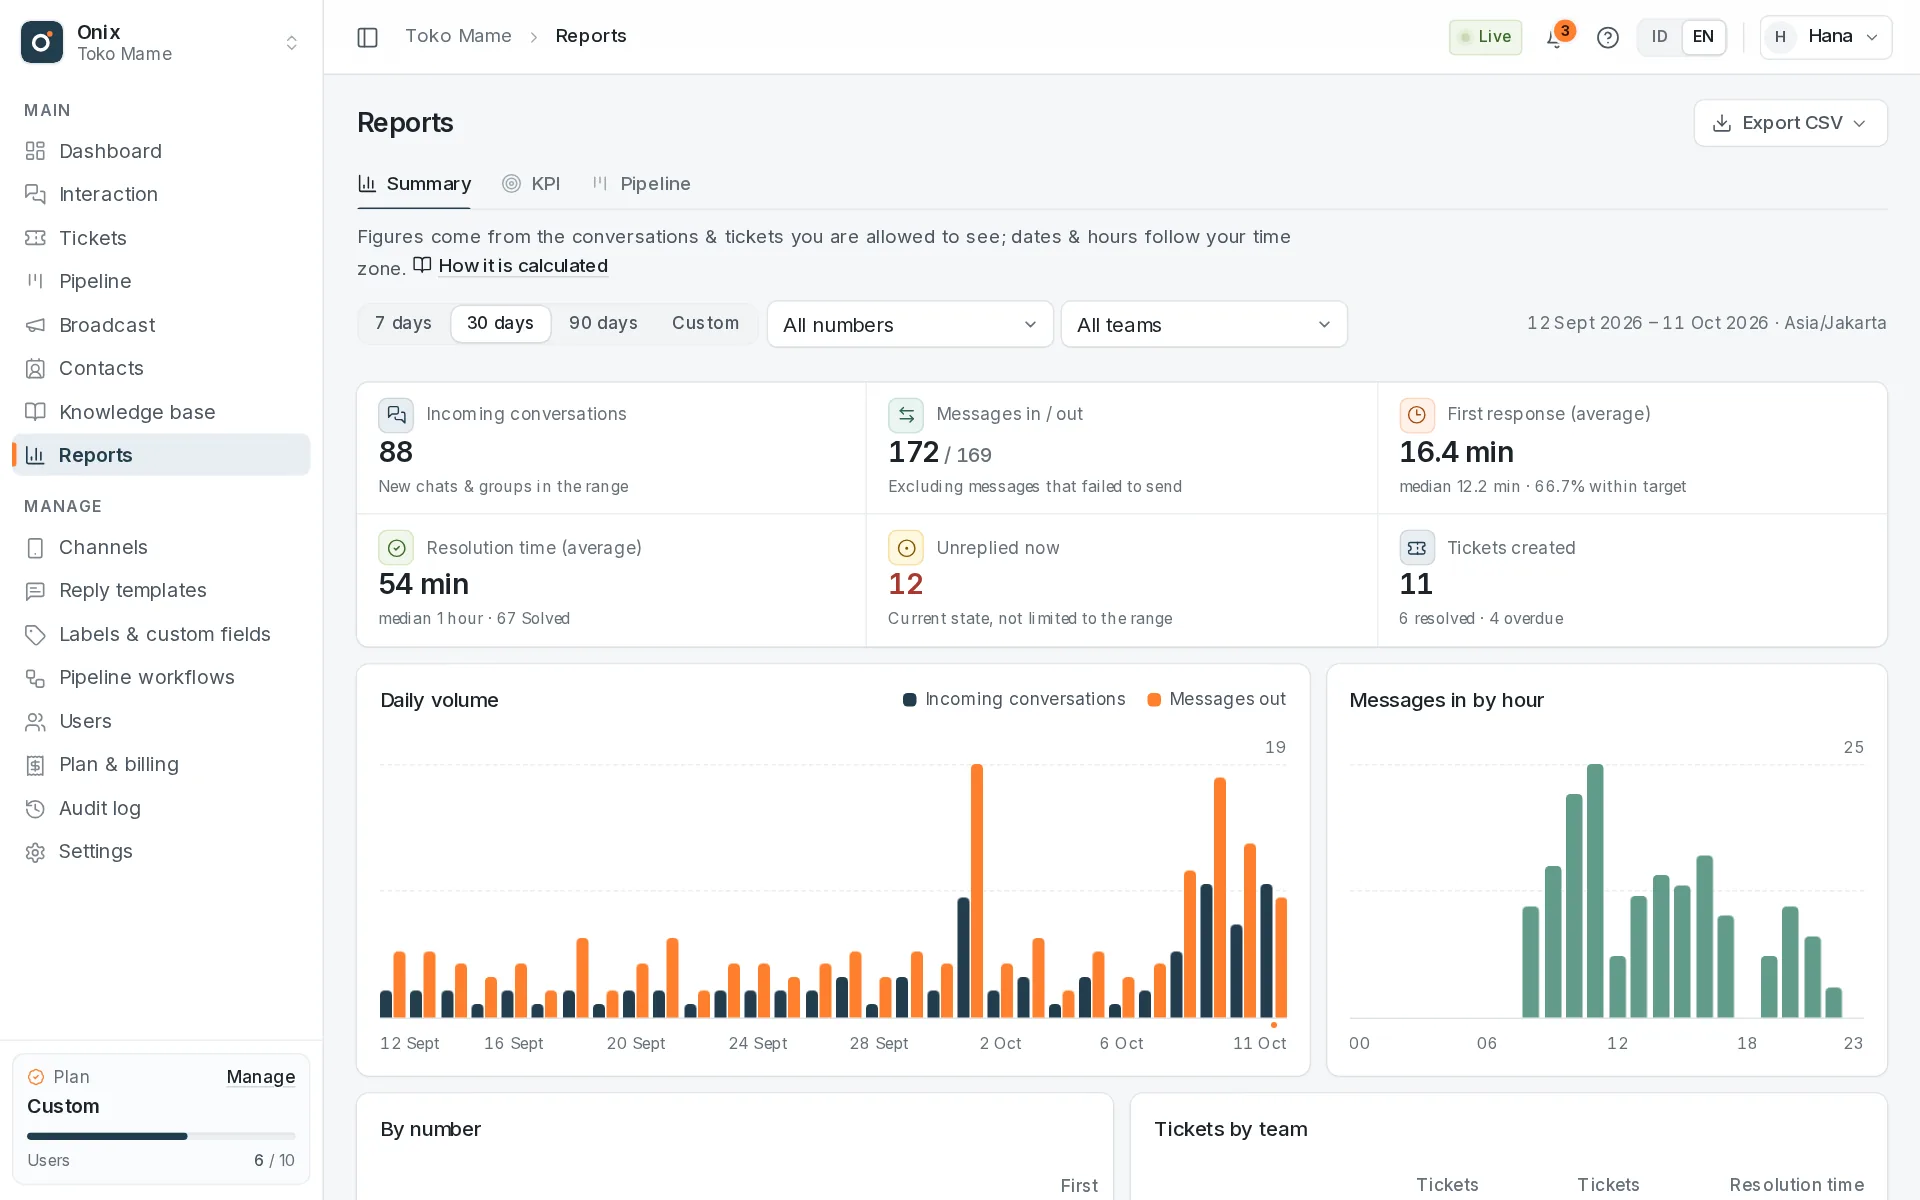
- Choose the last 7, 30 (default), or 90 days (including today), or Custom with two dates (up to 366 days).
- Dates and hours follow your time zone (your personal zone in My account, or the workspace zone). "Today" starts at 00:00 in your zone; the hourly chart also uses hours in your zone.
- Number filter: only that number's conversations & messages. Team filter: a Frontline team filters conversations, a Back Office team filters tickets.
- Filters are kept in the page address, so you can share the link with colleagues who also have report access.
Formulas
| Figure | How it is calculated |
|---|---|
| Incoming conversations | Number of conversations (chats & groups) created in the range. A new conversation is created when a customer writes for the first time, or writes again after the previous conversation was Solved/Closed. |
| Messages in / out | Number of messages from customers / messages sent by the team in the range. Messages that failed to send, internal notes, and system messages are not counted. |
| First response | For incoming conversations in the range that have been replied to: the time from the customer's first message to the team's first reply. Shown as average and median. % within target = the share of those conversations answered no later than the First response target in Settings → General (shown when a target is set). |
| Resolution time | For conversations marked Solved in the range: the time from creation to Solved. Average and median. |
| Unreplied now | Open conversations currently waiting for a reply. This is the current state and does not depend on the range. |
| Daily volume | Per date (your zone): incoming conversations and messages out as bars; messages in appear in the tooltip when you hover a bar. |
| Messages in by hour | Customer messages in the range, grouped by hour 00–23 in your zone — to spot busy hours. |
| By number | Per WhatsApp number: incoming conversations, messages in, messages out, and average first response. |
| By label | Per Onix contact label: incoming conversations whose contact has that label. One conversation can count toward several labels. |
| By category | Per conversation category: incoming conversations. A parent category adds up its subcategories; subcategories are indented below their parent (the CSV also includes the category path and the count assigned directly). Conversations without a category are counted in the Uncategorized row. |
| Tickets | Created = tickets created in the range. Resolved = tickets resolved (Resolved, or Closed directly) in the range. Resolution time = from ticket creation to resolution. Overdue = active tickets whose due date has passed right now. The Tickets by team table uses Back Office teams. |
| Agent productivity | Per active member: Replies = messages they sent; Conversations replied = number of distinct conversations they replied to; First responses = incoming conversations in the range whose first reply came from them (count & average time); Tickets resolved = tickets they changed to Resolved. |
Per-person KPIs
The KPIs tab in Reports (Pro & Custom plans) shows each member's performance against their targets, counted in business hours. The formulas are in KPIs & SLA.
Average and median
The average adds up all times and divides by the number of conversations. The median is the middle value: half of the conversations were faster, half slower. When the average is far above the median, a few conversations usually took very long (for example, ones that came in at midnight) — the median better reflects the everyday customer experience.
Times under one hour are shown in minutes, longer ones in hours (one decimal place).
CSV export
- The Export CSV button at the top right: Summary, Daily, By number, By label, By category, Agent productivity, or Tickets by team — for the range & filters currently selected.
- Files are UTF-8, so they open correctly in Excel and Google Sheets. File name:
laporan-{type}-{from}-{to}.csv. - Exports are available in the app only. For integrations, the same data is available as JSON at
GET /api/v1/reports/…(see API). - The Pipeline tab (also requires Pipeline access): raw data CSV for leads (all columns + custom fields), activities, and expenses — by workflow, status, period, and the leads you can see. See Pipeline.